Tutorial#
Gridverse (GV) is a library for the construction of custom gridworld MDP and POMDP environments. Its main purpose is to allow you, the designer, to easily create environments based on your research needs. These sections serve as a tutorial which will guide you towards understanding the inner workings of the library, the usage of predefined components, and the creation of your own custom components. This tutorial has 3 main sections:
Usage—how to instantiate and use GV environments (useful for practitioners).
Design—how do GV environments work internally (useful for contributors).
Customization—how to create custom environments (useful for practicioners).
But before that, let’s first have a quick look at what we’re talking about. GV
provides a few useful scripts, one of which is
scripts/gv_control_loop_gym.py, which visualizes the behavior of a
random policy. Open a terminal, move to the root of the project, load a python
environment with GV installed, and run:
gv_control_loop_gym.py yaml/gv_memory_nine_rooms.13x13.yaml
This should open two windows, and start printing some data.
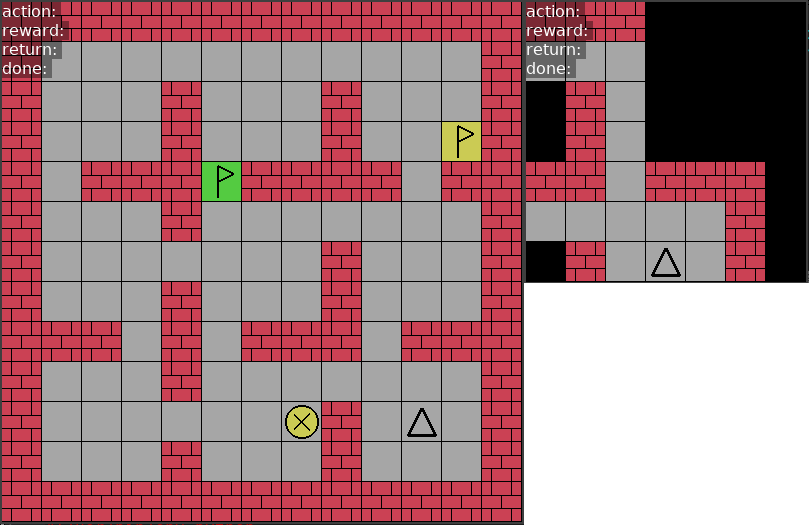
Fig. 1 Global state (left) and agent observation (right).#
The windows respectively represent the state of the environment (the bigger one) and the observation received by the agent (the smaller one). You’ll note the agent (black triangle) moving around in a gridworld which contains the following grid-objects:
Floor cells (gray tiles);
Wall cells (red bricks);
Exit cells (colored flags);
Beacon cells (colored circle with cross).
Because the agent is just selecting random actions, its behavior will be a quite boring random walk. In the terminal, you should see some information corresponding to its behavior and trajectory.
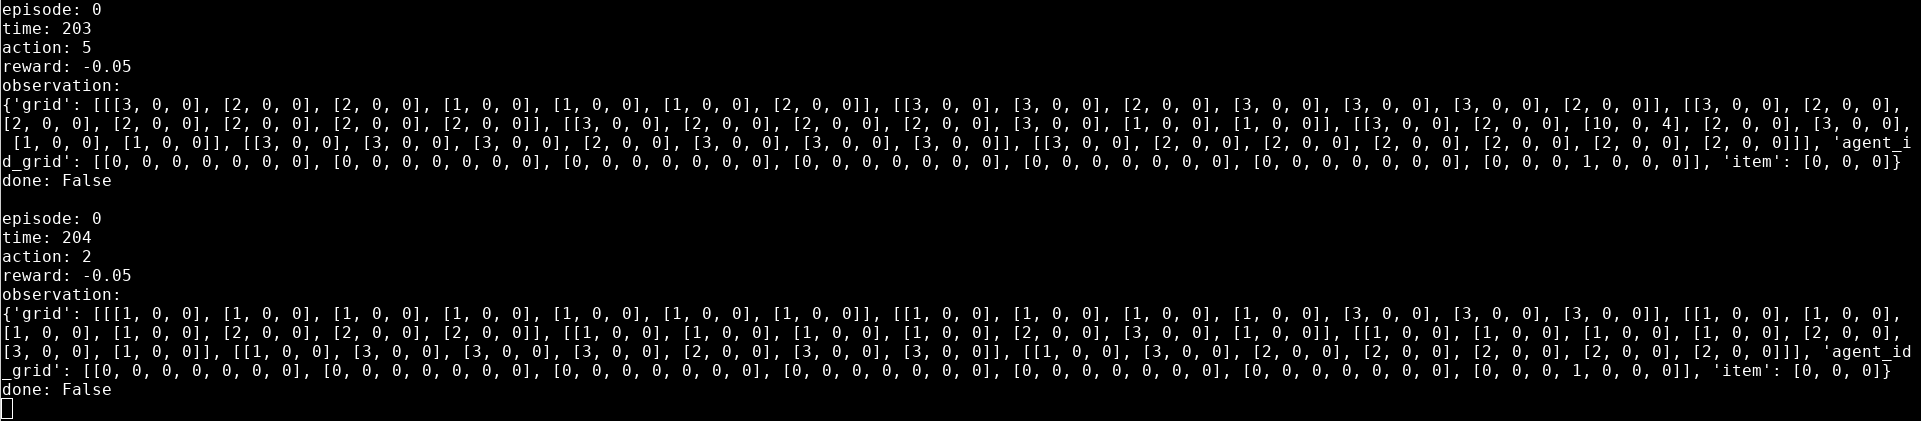
These include:
Episode index;
Timestep index;
Action (as integer);
Reward;
Observation (as dictionary of numpy arrays);
Done condition.
Caution
The graphics in Fig. 1 are specifically for human
comsumption only, and do not represent how this data is provided to the
agent. Rather, the Observation field in Fig. 2
shows how this data is provided to the agent, i.e., in the form of a
dictionary of numpy arrays. The state (omitted) has a similar structure,
albeit with a different set of keys. Both data formats will be explained
later in this tutorial.